|
Parametric Shape Representation by a Deformable NURBS Model for Cardiac Functional Measurements |
|
Sheng Yong Chen, Senior Member, IEEE, Qiu Guan |
Abstract?/span>This paper proposes a method of parametric representation and functional measurement of three-dimensional cardiac shapes in a deformable NURBS model. The representation makes it very easy to automatically evaluate the functional parameters and myocardial kinetics of the heart since quantitative analysis can be followed in a simple way. In the model, local deformation and motion on the cardiac shape are expressed in adjustable parameters. Especially, an effective integral algorithm is used for volumetric measurement of a NURBS shape since the volume is the most basic parameter in cardiac functional analysis. This method promises the numerical computation very convenient, efficient, and accurate, by comparison with traditional methods. Practical experiments are carried out and results show the algorithm can get satisfactory measurement accuracy and efficiency. The parametric NURBS model in cylindrical coordinates is not only very suitable to fit the anatomical surfaces of a cardiac shape, but also easy for geometric transformation and nonrigid registration and able to represent local dynamics and kinetics, and thus can easily be applied for quantitative and functional analysis of the heart.
Index Terms?/span>Cardiac shape representation, 3D cylindrical NURBS, parametric representation, deformable model, computer vision, biomedical image, dynamics and kinetics
I. INTRODUCTION
|
C |
ardiovascular diseases are the leading cause of death now in the world and the rate of death is increasing each year in many countries [1]. At present, imaging techniques, such as magnetic resonance imaging (MRI), computed tomography (CT), positron emission tomography (PET), single photon emission computed tomography (SPECT), ultrasound, and X-ray, provide noninvasive methods to study internal organs in vivo [2]-[6]. Automatic evaluation and visualization of a three-dimensional (3D) heart, or even a 4D beating heart [7]-[9], has the capability to improve the diagnostic value of cardiac images. This is not only because many diseases are strongly correlated to the shape of heart, but also because, due to the development of medicinal imaging techniques, much more useful cardiac information has been provided while clinical diagnosis and treatment of cardiac diseases become more complex. It is often the first step to obtain many other functional parameters, especially for those related to myocardial kinetics.
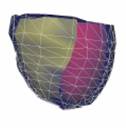
Several techniques have been used to construct 3D hearts; however, most of the clinical information is still constrained to two dimensions. In this aspect, Pentecost et al. use non-uniform rational B-Spline contours to form embryonic heart surface model and the control points of the contours are identified and outlined manually at each section [10]. The whole surface is not continuous although the contours are smooth and continuous. Young et al. and Park et al. use finite element methods to represent and analyze the heart model (as shown in Fig.1a) [11] [9]. Static, comprehensive end-diastolic cardiac surfaces including four cardiac chambers and connected vasculature are presented as a triangular mesh [12].
There may be alternative ways to recovery of the ventricular surface and even the whole heart. Cardiologists used simplified shapes to approximate the ventricles. In the early years, for example, Dulce et al. attempted simple ellipsoidal models [13]. However, since it was rather rough, it can offer only a few diagnostic parameters. In late 1990s and early 2000s, some 3D surface models and graphical techniques have been developed to capture the shape and the other parameters from medical image sets [14]. These models are finite element model, physics-based elastic model, bending and stretching model and B-Spline model, statistical shape models, etc. [1], [15]-[18]. Most of them are based on simple geometries. For example, Cauvin et al. approximate the ventricle as a truncated bullet, which is much more close to the real structure of ventricle compared to an ellipsoid [19]. Chen et al. apply superquadrics to model the ventricle [20]. Staib and Duncan use sinusoidal basis functions for shape recovery [21]. Haber gives a 3D finite element model, in which the ventricle was divided into 16 bicubic Hermite finite elements [22]. Although it can provide clinically important information, it is still too coarse. Luo et al. use a B-spline model but the ventricle is considered as a generalized prolate spheroid (Fig. 1b) [23].
(a) ? (b) (c)
Fig. 1 Some typical cardiac models. (a) The finite element model of a generic heart (after Park et al. 2003 [9][11]); (b) the LV model with prolate spheroid fitting (after Luo et al. 2005 [23]); and (c) the active appearance model (after Andreopoulos et al. 2008 [17])
In recent years, although the active shape model (ASM) or active appearance model (AAM) is still the most concerned method [1],[2],[15]-[17],[24],[25], researchers have made efforts to alternative ways for deformation analysis and tetrahedral representation [26]-[28]. For example, Sun et al. propose branching medial models for cardiac shape representation [29]. They extend the cm-rep (continuous medial representation) to more complex shapes with multi-figures, i.e., shapes whose skeletons have branches. Along the branching curves, the equality constraints enforced by the medial geometry are implemented as soft penalties in the deformable model. The remaining small violations are corrected by local adjustments. Huang and Metaxas present the Metamorphs model which integrates shape and appearance in a unified space [30]. The Metamorphs formulation allows natural merging and competition of multiple models. It examines not only edge information but also its exterior region statistics to ensure that it only expands to new territory with consistent appearance statistics.
With the motivation for easy measurement of functional parameters and easy representation of cardiac kinetics, this paper gives the most attention to the derivation of specific non-uniform rational B-Splines (NURBS) for heart modeling. NURBS are mathematical representations of 3D geometry that can accurately describe any shape from a simple 2D line, circle, arc, or curve to the most complex 3D organic free-form surface or solid. Because of their flexibility and accuracy, NURBS models can be used in any process for illustration and animation.
Merely on shape representation, there is little new here to apply NURBS. In fact, Segars et al. and Pentecost et al. attempted to adopt NURBS for cardiac shape representation about 10 years ago [31],[10]. In the similar way, Zhang represents a human head with bi-cubic B-Spline technique [33] and Klingensmith uses B-Splines to model lumen and vessel surfaces [34]. In recent years, this attracts more researchers in cardiac research, e.g. [7],[32],[35]. However, the model must be anatomically accurate, allow manual editing, provide sufficient information to guide automatic segmentation, and be very easy for geometric transformation for nonrigid body registration [36]. Furthermore, there are two important issues that we have to discuss but have not appeared in the literature. One is what coordinate system is good for manipulating a cardiac shape where we require the model not only to be easy for representation, but also flexible for shape deformation. The other is how to derive a mathematical formulation that is efficient and accurate for computation of functional parameters.
For these emerging problems, this paper proposes the deformable NURBS model to manipulate the cardiac shapes in cylindrical coordinates. From 3D cardiac medical images, after a statistical model is used to find the anatomical boundaries of the cardiac ventricles or epicardial surfaces, the point clouds are fitted and represented with a smooth and continuous NURBS shape. The method tries to make the cardiac shape smooth and close to the actual data, but also flexible enough for shape deformation. The principle and derivation of functional parametric computation, especially for volumetric measurement, are proposed in this paper. Practical implementation and experiments are carried out to verify that the proposed method has high flexibility for surface fitting, representation, visualization, and functional computation in processing of 3D cardiac images. Furthermore, we believe it is one of the most convenient methods for geometric transformations for nonrigid body registration.
II. Deformable NURBS Shape
A. Cylindrical Representation of NURBS Shapes
NURBS are very suitable for representing cardiac shapes because we can take the advantage of several characteristics, e.g. 1) smooth and continuous, 2) flexible to represent both simple and complex shapes by some control points, and 3) easy to be modified locally without changing the shape in a global way. Traditionally, the NURBS surface is represented in the Cartesian coordinate system. A 3D surface of order k1 in the u direction and order k2 in the v direction is given by the following function
 (1)
(1)
where: s(u, v) is a point on the surface defined in Cartesian coordinates (x, y, z), u and v are usually representing longitude and latitude respectively, n+1 and m+1 are the number of control points in the u and v directions respectively, pi,j is the (m+1)?/span>(n+1) matrix of control points defined in Cartesian coordinates(xij, yij, zij), Ni,k1(u) and Nj,k2(v) are the basic functions in the u and v direction using degree k1 and k2, and wij are the weights related to the corresponding control points.
As can be found from practical implementation, a NURBS model in cylindrical coordinates is very close to the ventricular shape. Figure 2 shows a ventricular curve from an MRI slice image. Fitted with the same order for the same control points, the NURBS curve in cylindrical coordinates is more close to the tubular objects than that in a Cartesian coordinate system. This is also true in the 3D system. In other words, the cylindrical coordinate system needs less control points, i.e. the landmarks on the cardiac shape, to reach the same precision. This is an important merit for both manual creation of the statistical model from the training set and automatic segmentation from image volumes.
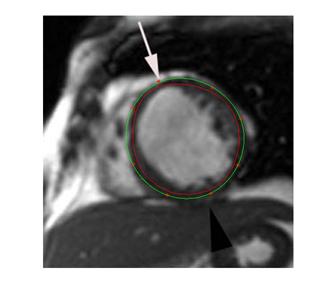
Fig. 2 The NURBS curve in cylindrical coordinates gets a better precision for a set of control points in a same order. The green curve is fitted in cylindrical coordinates for an MRI slice image. The red curve is fitted in Cartesian NURBS. The eight marked points are feature positions.
TABLE I Comparison of NURBS fitting errors between cylindrical and Cartesian coordinates
|
dist error |
FP1 |
FP2 |
FP3 |
FP4 |
|
|||||
|
Cartesian |
9.378 |
7.985 |
8.384 |
6.937 |
|
|||||
|
cylindrical |
1.854 |
1.585 |
0.316 |
0.796 |
|
|||||
|
FP5 |
FP6 |
FP7 |
FP8 |
mean |
std |
|||||
|
7.561 |
8.210 |
9.675 |
8.309 |
8.305 |
0.892 |
|||||
|
0.623 |
0.237 |
0.939 |
0.088 |
0.805 |
0.637 |
|||||
By fitting the eight feature points marked in Fig. 2, Table I lists the minimum distance of each point to the fitted NURBS curve in both Cartesian and cylindrical coordinate systems. The mean values and standard deviations are also given. The mean errors are computed to be 8.305 pixels and 0.805 pixels, respectively. It is obvious that the fitting precision in cylindrical is much higher than that in Cartesian, which is about 10 times actually. With less feature points, we get more significant in error difference. The reason is that, due to the NURBS property, the fitted curve always lies inside the polygon in Cartesian coordinates, but it bounds on both sides in cylindrical coordinates.
In the cylindrical case, a NURBS surface is defined in coordinates (r, q, z), i.e.
 (2)
(2)
where pi,j = [rij, qij, zij].
Here, a coordinate transformation should be performed to convert the given (m+1)?/span>(n+1) matrix of control points (xij, yij, zij) into cylindrical coordinate points (rij, qij, zij)(i=0,1,?n, j=0,1,?m), where
![]() (3)
(3)
 ?(4)
?(4)
In order to make it easy to compute the derivatives and analyze the geometric properties of a NURBS surface, we represent the surface in a matrix form, which can also achieve a better temporal or spatial performance for a large number of control points. The surface in this case is represented as
![]() ?(5)
?(5)
where t = (u-ui)/(ui+1-ui), w = (v-vi)/(vi+1-vi), t?/span>[0, 1), w?/span>[0, 1),
 (6)
(6)
where V is a k1?/span>k2 matrix, ![]() and
and ![]() are
the ith and jth basis matrixes in the nonempty intervals [ui,
ui+1) and [vi, vi+1), respectively.
are
the ith and jth basis matrixes in the nonempty intervals [ui,
ui+1) and [vi, vi+1), respectively.
Also proved in practical experiments, the NURBS in cylindrical coordinates are suggested to represent the cardiac model because it can achieve more accurate results in the same computation complexity, more convenient for editing or shape reformation, more intuitive for implementation of segmentation, and easier for geometric transformation or nonrigid registration.
B. Data Organization
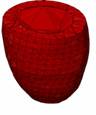
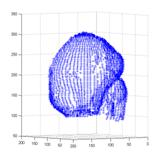
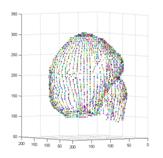
The way to create a cardiac NURBS surface involves three steps: (a) obtain the point cloud by fitting an ASM into a medical image volume, (b) generate a triangular surface mesh automatically and then convert it into a tetrahedral mesh [28],[37], (c) create the NURBS surface from the tetrahedral mesh (Figs. 3-4).
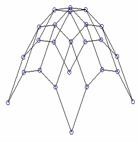
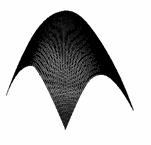
Fig. 3 From a point cloud to a NURBS surface
Fig. 4 The point data set and the cylindrical representation of NURBS. (a) A point set of a cardiac shape found from an image volume by ASM. (b) The smooth NURBS surface created from the point set
C. Shape Simplification and Deformation
Local deformation of a cardiac shape can be easily managed on a NURBS surface. In fact, there are two methods to modify a NURBS shape. One is to move the related control points and the other is to adjust corresponding NURBS weights. Either way does not affect other areas on the shape. The size of this deformable local area is dependent only on the adjustable points or weights.
Represent a parametric NURBS curve, S, which consists of a set of control points, C, and a set of weights, W
S = S(C, W) (7)
where
C = {Pi}, W = {wi}, i = 0, 1, ? n. (8)
In case of adjusting the positions of control points, we may denote a new state of the NURBS curve (7) as S*, with the control points C moved to C*. If the position difference is dc, we have
![]() ?(9)
?(9)
where
![]() ?(10)
?(10)
and  (11)
(11)
In case of adjusting weights, let W* = lW, and we may find the control points are moving along a straight line. In fact, a point moves from Pih=[wiPi wi] to Pih*=[liwiPi liwi]. Then the new state of the NURBS curve S* becomes
![]() ?(12)
?(12)
where
![]() (13)
(13)
Equations (12) and (13) are in homogeneous form and they can be rewritten as
![]() ?(14)
?(14)
where
![]() (15)
(15)
and  (16)
(16)
Fig. 5 Parametric shape representation for simplification and deformation. After a point cloud is the cardiac shape is obtained from the image volume, some subsets of image slices can use the NURBS representation with the same control points but different weights.
With the two opinions, it is easy to represent the shapes for simplification and deformation. After a point cloud of the cardiac shape is obtained from the image volume, some subsets of image slices can use the same NURBS representation with the same control points but different weights, so that the shape geometry is simplified. The cardiac deformation can also be observed directly from the variation of the weights. Fig. 5 illustrates the idea of shape representation.
The smoothness of a shape can be found directly from the first order derivation of the NURBS surface in longitude direction. In fact, after this derivation the shape is still a NURBS surface but in one lower order and therefore it is very convenient in computation.
D. Myocardium Motion and Kinetics
Now consider the motion and kinetics of the cardiac walls. In this case, we need a temporal set of 3D images, or a 4D image, related to an individual study in a cardiac cycle. Assume that the data set is sampled at a certain frequency and each image volume represents a phase state of the beating heart. After all 3D data sets are obtained from the image volumes, we may find a mean state of the cardiac shape by averaging all corresponding points. The motion and kinetics of a surface patch can be related to the NURBS points or weights.
Figure 6 illustrates the 3D NURBS representation for dynamics and kinetics. The local motion or kinetics of the cardiac wall includes a temporal set of spatial positions or dynamical mechanics, and they are mapped on a “mean?shape (Fig. 6a) attached with additional NURBS weights or “scalars?(Fig. 6b).
(a) (b)
Fig. 6 Parametric 3D Shape representation for local motion and kinetics. The local motion or kinetics of the cardiac wall includes a temporal set of spatial positions or dynamical mechanics, and all these values can be mapped on a “mean? shape (a) associated with additional NURBS weights or “scalars?(b), i.e. dynamics=(a)+(b).
III. Derivation for Volumetric Measurement
Volumetric measurement is very important because it is fundamental for assessment of the cardiac functions. Many parameters are based on such measurement, e.g. the left and right ventricular volume (LVV and RVV), left ventricular mass (LVM), cardiac output (CO), cardiac index (CI), end diastolic volume (EDV), ejection fraction (EF), end systolic volume (ESV), stroke volume and its index (SV and SVI).
For a surface, the volume can be determined by
![]() (17)
(17)
where A(z) is the area of the slice at depth z [35].
Let ?/span>S(t, w)/?/span>t and ?/span>S(t, w)/?/span>w denote the derivatives of S(u, v) with respect to t and w, respectively. The variable t is for transverse and w for lengthways. The area of a slice at depth z can be determined as
![]() (18)
(18)
Y(t, w) is given by (5). ?/span>X(t, w)/?/span>t is the derivative with respect to t and ?/span>Z(t, w)/?/span>w is the derivative with respect to w, i.e.
![]() (19)
(19)
![]() (20)
(20)
Therefore, the volume can be found as
![]() ?
?
![]() ?
?
![]() ?(21)
?(21)
Considering a NURBS surface of orders k1?/span>k2, its volume can be finally determined
![]() (22)
(22)
where Ci,j is the matrix of size 3k1?/span>3k2 which is the product of the three polynomials Y(t, w), ?/span>X(t, w)/?/span>t and ?/span>Z(t, w)/?/span>w. The element coefficient at row l1 and column l2, Ci,j, is calculated as
 (23)
(23)
When expressed in the cylindrical system, (18) is replaced with
![]() (24)
(24)
where ![]() (25)
(25)
![]() ?(26)
?(26)
The volume is determined by
![]() ?
?
![]()
![]() ?(27)
?(27)
where Cqi,j is the matrix of size 4k1?/span>4k2 representing the product of the four polynomials R(t, w), R(t, w), ?/span>q(t, w)/?/span>t and ?/span>X(t, w)/?/span>t.
IV. Experiments and Results
A. Accuracy and Efficiency
It is concluded that for the representation of cardiac shapes the NURBS surface in cylindrical coordinates is a meaningful way in aspects of parametric computation and kinetic manipulation. Here we further test the accuracy and efficiency of its representation. In one experiment, we numerically create a frustum of a cone for computation because its shape is similar with a ventricle. In a typical example, the parameters of the cone were: r = 1 cm, R = 2 cm, h = 4 cm. Its actual volume can be calculated as: Vtrue = ph(R2 + Rr + r2)/3 = 29.3215cm3. This value is used for calculating the errors. In another experiment for estimating the precision of the NURBS integral algorithm in measurement of ventricular volume, we still take the example of an image slice shown in Fig. 2. Here we give a manually labeled boundary of the LV on the slice, as the red curve shown in Fig. 7. It is used as the ground truth for computing the measurement error. We generate some points on that boundary as the feature points, as the green dots shown in Fig. 7. These points are fitted into a closed NURBS curve, the green curve, for computing the area size (or volume in 3D).
We compared two methods of volume computation. One is by Simpson’s rule which is the most common method for numerical integration of definite integrals. The other is the proposed integral algorithm of NURBS surfaces, which is better than that in a Cartesian system as we have concluded. With the NURBS, the surface is fitted with 9? control points. In Simpson’s rule, the integration is approximated by
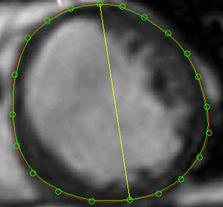
Fig. 7 Testing of accuracy and efficiency by different methods. The red curve is a manually labeled boundary of the left ventricle on an MRI slice image, which is used as the ground truth. Select 24 points on the curve as feature positions and fit them into a closed NURBS curve (i.e. the green one). The difference of area sizes between the two curves reflects the volumetric measurement error.
![]() (28)
(28)
The accuracy of Simpson’s integration is dependent on the number of segments and its error is proportional to (b − a)5, i.e.
![]() (29)
(29)
where ξ is some number between a and b.
From the results of the frustum of a cone, the volume determined by the NURBS integration is perfectly the same as the actual volume (29.3215cm3), i.e. the measurement error is 0. This is because a NURBS curve can exactly represent most of common quadric surfaces or conic curves. The computation error by Simpson’s rule is between 0.0022-0.2960, i.e. 0.008-1.01%, depending on the curve orders and number of segments. Considering the efficiency, the NURBS integration takes about 0.22 seconds and Simpson’s rule takes 0.58 ?109.64 seconds. Therefore, Simpson’s rule costs much more time especially when increasing the number of control points (which is very necessary to compute a complicated object like the heart). For the example shown in Fig. 7, the true area size is 29.5827 cm2. The value determined by NURBS integration in Cartesian coordinates is 28.9100 cm2 and that in cylindrical coordinates is 29.5001 cm2, corresponding to 2.27% and 0.28% errors, respectively. The error by Simpson’s rule is about 0.29-2.1% dependently. In computation time, there is a similar conclusion we got from the experiment of the frustum of a cone.
Another conclusion we may find is that higher orders NURBS surfaces doesn’t significantly increase the precision of results. Therefore, the 3?/span>3 orders are suggested to be enough for practical implementation. In the cylindrical system, as the volume is a linear dependency on z, the exact comparable result of accuracy and efficiency can be examined on an individual slice. Therefore, the NURBS integration algorithm in cylindrical system is significantly superior in both accuracy and efficiency.
 |
B. Representation and Measurement
Besides the numerical validation, this research also carried out a lot of experiments on practical medical images. The cardiac shapes shown in Figs. 4-6 are constructed from a number of images which correspond to cardiac computed tomography (CT) slices.
For one instance, the volumetric measurements are carried out with cylindrical representation of NURBS shapes and calculated to obtain accurate results for cardiac functional parameters. Table II shows the measurement results of one typical ventricular shape by NURBS integration and its comparison with that by Simpson’s rule. It is obvious that the proposed volumetric arithmetic based on integration of cylindrical NURBS gets more satisfactory and with only a very low time cost.
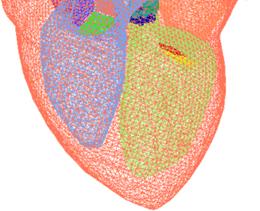
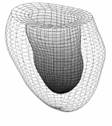
Fig. 8 The tetrahedral heart model (after Zhang et al. [37])
There are some other data sets available on the web which can be used for testing. For examples, the "Heart Model with Valves" (Fig. 8), the Project MedX in Computational Visualization Center, University of Texas at Austin [37]; the supplementary material and data associated with the article [17]; and the Heart from 3D Meshes Research Database (with more than 80000 3D meshes classified in various formats, www-roc.inria.fr/gamma). With the first example, we obtained a constructed tetrahedral heart model without some components, such as aorta, veins, and heart valves, the four chambers (left, right atriums and ventricles) are extracted and represented again in NURBS surfaces for volumetric and functional measurements.
Furthermore, with the proposed technology in this paper, either interactive modification of the shape or automatic deformation of the ventricles can be implemented easily with the cylindrical representation of NURBS shapes. Cardiac dynamics and kinetics can also be integrated in one model with variable parameters of NURBS control points and weights, i.e. C and W in (7).
C. Functional Analysis
Among the many quantitative and functional parameters of the heart, the LVV, RVV, EF, CO, CI, LVM, ESV, EDV, ESV, SV, SVI, etc. are called volume-based functional descriptors. Some others like tissue motion field (MF), wall thickening (WT), velocity (Vwt), etc. are called tissue-based functional descriptors. The former can usually describe the working status of the heart and the latter are usually used to analyze and predict the prospect of the heart (e.g. through analysis of some regional myocardial dynamics). The cylindrical representation of the cardiac NURBS shapes can help to determine most of these descriptors.
Besides the cardiac functions based on volumetric measurements, the 3D NURBS model is especially useful to analyze the motion and dynamics of the epicardium or cardiac muscles from which people can often find cues of cardiovascular diseases at a very early stage.
Take one more example of continuous volumetric analysis. If we have a series of 3D image volume for a complete cardiac cycle, we can determine the changes in volume as the heart beats. The 3D models constructed with NURBS representation in cylindrical coordinates. The volumes are determined as in a sequence. A volumetric curve through the complete cardiac cycle can be found by fitting the numbers, from which the quantities like LVV and EF can be found directly.
V. Conclusion
This paper proposes an accurate and efficient method for representation and manipulation of 3D cardiac shapes. A deformable model is represented by parametric NURBS surfaces which contain adjustable control points and weights in cylindrical coordinates. Compared with the most common method of numerical integration (Simpson's rule), the derived equation for computing the volume of the NURBS shape can achieve much better accuracy and efficiency. Furthermore, the proposed NURBS model and its parametric scheme can especially be useful to analyze the motion and dynamics of the heart, which is important for doctors to find early cues of cardiovascular diseases. The paper provides the required mathematical expressions and shows practical examples useful for implementation and understanding.
Acknowledgment
Thanks to Chao Jiang, Yahui Du, Tingting Jiang, and Fang Wang for their helping in doing experiments during their study in the research group. Some testing data sets were provided by the Research Institute of Cardiovascular Disease in the Zhejiang First Hospital and the Sir Run Run Shaw Hospital.
References
[1] T. Heimann and H. -P. Meinzer, "Statistical shape models for 3D medical image segmentation: A review", Medical Image Analysis, Vol. 13, No. 4, pp. 543-563, Aug. 2009.
[2] Y. Zheng, etc., "Four-Chamber Heart Modeling and Automatic Segmentation for 3D Cardiac CT Volumes Using Marginal Space Learning and Steerable Features", IEEE Transactions on Medical Imaging, Vol. 27, No. 11, pp. 1668-1681, Nov. 2008.
[3] O. Ecabert, etc., "Automatic Model-Based Segmentation of the Heart in CT Images", IEEE Transactions on Medical Imaging, Vol. 27, No. 9, pp. 1189-1201, Sep. 2008.
[4] Jeroen Verhaeghe, Yves D'Asseler, Steven Staelens, Stefaan Vandenberghe, Ignace Lemahieu, "Reconstruction for Gated Dynamic Cardiac PET Imaging Using a Tensor Product Spline Basis," IEEE Transactions on Nuclear Science, vol.54, no.1, pp.80-91, Feb. 2007.
[5] Prassl, A.J., etc, "Automatically Generated, Anatomically Accurate Meshes for Cardiac Electrophysiology Problems," IEEE Transactions on Biomedical Engineering, vol.56, no.5, pp.1318-1330, May 2009.
[6] Linwei Wang, etc., "Physiological-Model-Constrained Noninvasive Reconstruction of Volumetric Myocardial Transmembrane Potentials," IEEE Transactions on Biomedical Engineering, vol.57, no.2, pp.296-315, Feb. 2010.
[7] N. Tustison and A. Amini, "Analysis Of 4-D Cardiac MR Data With Nurbs Deformable Models: Temporal Fitting Strategy And Nonrigid Registration", Deformable Models, Springer, 2007, pp. 493-534.
[8] Huafeng Liu and Pengcheng Shi, "Maximum a Posteriori Strategy for the Simultaneous Motion and Material Property Estimation of the Heart," IEEE Transactions on Biomedical Engineering, vol.56, no.2, pp.378-389, Feb. 2009.
[9] K. Park, D. Metaxas, L. Axel, "A Finite Element Model for Functional Analysis of 4D Cardiac-Tagged MR Images", Lecture Notes in Computer Science, vol. p491-498, 2003.
[10] J. O. Pentecost, J. Icardo, and K. L. Thornburg, "3D computer modeling of human cardiogenesis", Computerized Medical Imaging and Graphics, vol.23, no.1, pp. 45-49, Feb. 1999.
[11] Cristian Lorenz and Jens von Berg, "A comprehensive shape model of the heart", Medical Image Analysis, Vol. 10, No. 4, pp. 657-670, Aug. 2006.
[12] A.A. Young, D.L. Kraitchman, L. Dougherty, L. Axel, Tracking and finite element analysis of stripe deformation in magnetic resonance tagging. IEEE Trans Medical Imaging, vol. 14, no.3, pp. 413-421, 1995.
[13] M. C. Dulce, G. H. Mostbeck, K. K. Friese, G. R. Caputo, and C. B. Higgings, "Quantification of the left ventricular volumes and function with cine MR imaging: Comparison of geometric models with three dimensional data", Radiology, vol. 188, no. 2, pp. 371?76, 1993.
[14] J. Park, D. Metaxas, "Deformable Models with Parameter Functions for Cardiac Motion Analysis from Tagged MRI Data", IEEE Trans. Medical Imaging, vol. 15, no.3, pp. 278-289, 1996.
[15] M.E. Barley, etc., "Validation of a Novel Catheter Guiding Method for the Ablative Therapy of Ventricular Tachycardia in a Phantom Model," IEEE Transactions on Biomedical Engineering, vol.56, no.3, pp.907-910, March 2009.
[16] A. Suinesiaputra, A. Frangi, etc., "Automated Detection of Regional Wall Motion Abnormalities Based on a Statistical Model Applied to Multislice Short-Axis Cardiac MR Images," IEEE Transactions on Medical Imaging, vol. 28, no.4, pp.595-607, April 2009.
[17] A. Andreopoulos, J.K. Tsotsos, "Efficient and generalizable statistical models of shape and appearance for analysis of cardiac MRI", Medical Image Analysis, Vol. 12, No. 3, pp. 335-357, June 2008.
[18] X. Deng and T.S. Denney, "Three-Dimensional Myocardial Strain Reconstruction From Tagged MRI Using a Cylindrical B-spline Model", IEEE Transactions on Medical Imaging, Volume 23, Issue 7, pp. 861-867, July 2004.
[19] J. C. Cauvin, J. Y. Boire, M. Zanca, J. M. Bonny, J. Maublant, and A. Veyre, "3D modeling in myocardial 201TL SPECT. Computerized Medical Imaging and Graphics", vol. 17, no. 4?, pp. 345?50, 1993.
[20] C. W. Chen, J. Luo, K. J. Parker, T. S. Huang, "CT volumetric data-based left ventricle motion estimation: An integrated approach", Computerized Medical Imaging and Graphics, vol. 19, no. 1, pp. 85?00, 1995.
[21] L. H. Staib, J.S.Duncan, "Model-based deformable surface finding for medical images", IEEE Trans. Med. Imag., vol. 15, pp. 720?31, 1996.
[22] I. Haber, R. Kikinis and C. -F. Westin, "Phase-drive finite element model for spatio-temporal tracking in cardiac tagged MRI", Springer-Verlag Berlin, Heidelberg, 2001.
[23] G. Luo and P. A. Heng, "LV Shape and Motion: B-Spline Based Deformable Model and Sequential Motion Decompositionv, IEEE Transactions on Information Technology in Biomedicine, vol. 9, no. 3, pp. 430-446, Sep. 2005.
[24] H.C. van Assen, etc., "A 3D Active Shape Model Driven by Fuzzy Inference: Application to Cardiac CT and MR", Information Technology in Biomedicine, Vol. 12, No. 5, pp. 595-605, Sep. 2008.
[25] J. Koikkalainen, T. Tolli, etc., "Methods of Artificial Enlargement of the Training Set for Statistical Shape Models," IEEE Transactions on Medical Imaging, vol.27, no.11, pp.1643-1654, Nov. 2008.
[26] D. Moroni, etc., "Heart deformation pattern analysis through shape modelling", Pattern Recognition and Image Analysis, Vol. 19, No. 2, pp. 262-270, Jun. 2009.
[27] A. Sitek, G.J. Klein, G.T. Gullberg, R.H. Huesman, "Deformable model of the heart with fiber structure," IEEE Transactions on Nuclear Science, vol.49, no.3, pp. 789-793, Jun 2002.
[28] A. Sitek, etc., "Tomographic reconstruction using an adaptive tetrahedral mesh defined by a point cloud", IEEE Transactions on Medical Imaging, Vol. 25, No. 9, pp. 1172-1179, Sep. 2006.
[29] H. Sun, etc., "Branching medial models for cardiac shape representation", 5th IEEE International Symposium on Biomedical Imaging: From Nano to Macro, May 2008, pp. 1485 - 1488.
[30] X. Huang and D.N. Metaxas, "Metamorphs: Deformable Shape and Appearance Models", IEEE Transactions on Pattern Analysis and Machine Intelligence, Vol. 30, No. 8, pp. 1444-1459, Aug. 2008.
[31] W.P. Segars, etc., "A realistic spline-based dynamic heart phantom", IEEE Transactions on Nuclear Science, vol. 46, no. 3, pp. 503-506, 1999.
[32] W.P. Segars, S. P. Mok, B. Tsui, "Investigation of Respiratory Gating in Quantitative Myocardial SPECT," IEEE Transactions on Nuclear Science, vol.56, no.1, pp.91-96, Feb. 2009.
[33] B. Zhang, J.F.M. Molenbroek, "Representation of human head with bi-cubic B-Spline technique based on the laser scanning technique in 3D surface anthropometry", Applied Ergonomics, Elsevier, 2004.
[34] J.D. Klingensmith, D.G. Vince, "B-Spline methods for interactive segmentation and modeling of lumen and vessel intravascular ultrasound", Computerized Medical Imaging and Graphics, Pergamon, 2002.
[35] N.J. Tustison, V.G. Dávila-Román, and A.A. Amini, "Myocardial Kinematics From Tagged MRI Based on a 4-D B-Spline Model", IEEE Transactions on Biomedical Engineering, Vol. 50, 2003.
[36] M. Holden, "A Review of Geometric Transformations for Nonrigid Body Registration", IEEE Transactions on Medical Imaging, Vol. 27, No. 1, pp. 111-128, Jan. 2008.
[37] Y. Zhang, etc., "Heart Model with Valves" (Project MedX), Computational Visualization Center, University of Texas at Austin, http://ccvweb.csres.utexas.edu/ccv/projects/medx/heart/index.php
S. Y. Chen (M?1–SM?0) received the Ph.D. degree in computer vision from the Department of Manufacturing Engineering and Engineering Management, City University of Hong Kong, Hong Kong, in 2003.
He joined Zhejiang University of Technology in Feb. 2004 where he is currently a Professor in the College of Computer Science. From Aug. 2006 to Aug. 2007, he received a fellowship from the Alexander von Humboldt Foundation of Germany and worked at University of Hamburg, Germany. From Sep. 2008 to Aug. 2009, he worked as a visiting professor at Imperial College, London, U.K. His research interests include computer vision, robotics, 3D object modeling, and image analysis.
Prof. Chen is a senior member of IEEE and a committee member of IET Shanghai Branch. He has published over 100 scientific papers in international journals and conferences. He received the Research Award of Fok-Ying-Tung Education Foundation by Ministry of Education of China in 2006, was awarded as the Champion in 2003 IEEE Region 10 Student Paper Competition, and was nominated as a finalist candidate for 2004 Hong Kong Young Scientist Award.
Qiu Guan received master degree in control engineering from the Zhejiang University of Technology in 2004. She is currently an associate professor in College of Computer Science, Zhejiang University of Technology, China. Her research interests include computer vision, image processing, and computer aided diagnosis.